.png)


5 Benefits Of Cloud Processing For Small Businesses
HEAT MAPS plays a pivotal role in simplifying complex information and empowering businesses in the world of IT support, cybersecurity, and data visualization. If you’ve ever wondered about heat maps, how they work, and why businesses across industries are increasingly relying on them, you’re in the right place. This blog aims to demystify heat maps, explore their applications, and reveal how they can elevate decision-making processes. Let’s dive into the world of heat maps and uncover the transformative power they hold.
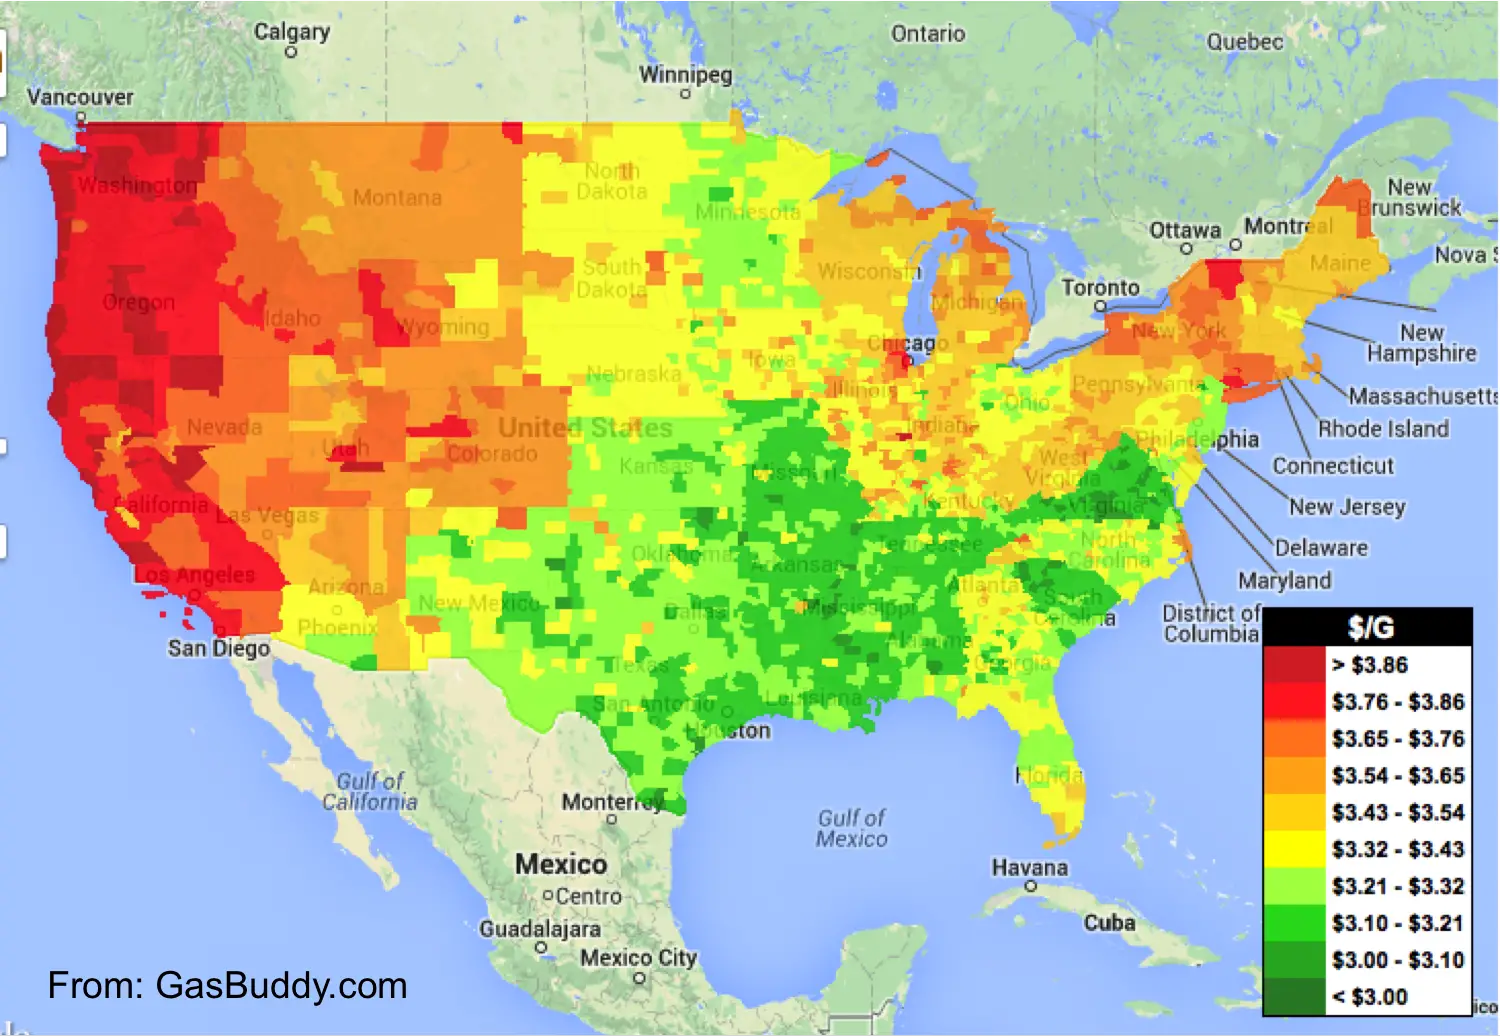
A heat map is a visual representation of data that uses colors to depict values. These graphical representations are instrumental in assessing the effectiveness of elements on a website or page and understanding user interactions with specific page components. By strategically placing buttons and elements on your website and analyzing heat maps, you can gain insights into your product’s performance. This, in turn, enables you to enhance user engagement and retention by prioritizing tasks that add customer value.
Heat maps serve to reveal relationships between two variables, each plotted along its respective axis. The color changes across these axes offer insights into patterns within one or both variables. These variables can encompass various types, including categorical labels or numeric values. In the case of numeric values, they must be categorized into bins, similar to a histogram, to create the grid cells where colors representing the primary variable of interest will be displayed.
The coloring of cells can correspond to diverse metrics, such as frequency counts of points within each bin or summary statistics like mean or median involving a third variable. Constructing a heat map can be likened to creating a table or matrix, with color encoding superimposed on the cells. In specific applications, cell coloring can also be based on non-numeric values, such as qualitative levels like low, medium, and high.
Heat maps are powerful tools that effectively distill vast datasets into easily digestible visual representations. They achieve this by utilizing a color spectrum, ranging from warm to cool, to illustrate the level of engagement and activity across various sections of your web pages. Typically, heat map analyses present data using colors that transition from vibrant red, shifting through shades of orange and yellow, before gradually cooling down into tranquil hues of green and blue. However, some variations may employ grayscale, while others progress from intense red to “white-hot” areas.
The fundamental purpose of heat maps remains consistent: to direct the viewer’s attention toward areas of interest, whether it’s heightened activity or a cooler response, all contingent on the specific context characterizing these areas. This graphical representation offers immediate insights into user behavior, highlighting where they focus their attention, where they linger, and where they may disengage. Heat maps enable businesses to make data-driven decisions to enhance user experience, optimize content placement, and boost engagement, ultimately leading to improved website performance and greater user satisfaction.
Variety in Heat Maps
Website heat maps encompass various types, each offering distinct insights that, when combined, provide a comprehensive overview of a particular web page’s performance. The most prevalent types of heat maps include:
Scroll Maps
Scroll maps provide a visual representation of how users interact with a web page by highlighting their scrolling behavior. Specifically, they reveal how far down the page users are willing to scroll and where they concentrate their viewing time. Scroll maps assist in determining the optimal length of a web page and the amount of content that should be visible before users need to scroll further. They offer guidance on placing essential content based on user engagement and activity.
Click Maps
Click maps reveal the areas on a web page where users most frequently click (or tap on mobile devices). These heat maps show which elements, such as images, buttons, text, or other page components, as well as areas where users try to interact but are unable to do so. Click maps aid in identifying both popular links and areas of user frustration due to unresponsive elements. This data is invaluable for optimizing menus, promotional banners, and CTAs to enhance user experience and ROI.
Move Maps
Move maps track users’ mouse movements across a web page, providing insights into their interaction with the content. They reveal what attracts users’ attention, what they focus on, and where they encounter difficulties. Move maps enable the identification of friction points and opportunities for improving content and CTAs within the design, ultimately resulting in a smoother digital customer experience.
Desktop vs. Mobile Heat Maps
Desktop and mobile heat maps offer the ability to compare user journeys between desktop and mobile platforms. Desktop heat maps illustrate how users interact with a website, while mobile heat maps provide insights into users’ interactions with a mobile app. Mobile heat maps can uncover user behavior, such as login preferences, which can inform user experience improvements. Identifying areas of struggle and abandonment in mobile apps helps create a positive user experience, encouraging user retention.
In essence, heat maps serve as indispensable tools for gaining actionable insights into user behavior and optimizing web pages and applications for enhanced engagement and user satisfaction.
Heat maps have numerous advantages, which we will discuss in detail below.
A heat map tool can help you answer some of your website’s most important questions, such as:
Building a website isn’t a one-and-done endeavor, especially if it’s your primary revenue driver. User behavior constantly evolves, making past strategies less effective. To truly deliver an exceptional digital customer experience, you must understand how your audience interacts with your content and optimize your website accordingly. Leveraging heat map tools can facilitate this understanding and prioritize necessary improvements.
CRO is the art of continually improving your website’s performance. The competitive digital landscape demands ongoing enhancements to your site. While your website may have merit, numerous factors can negatively affect user interactions, many of which are within your control. Identifying and rectifying these issues is paramount.
These factors can prevent users from completing conversion goals, such as making a purchase or requesting a callback. Not addressing these issues may result in a decline in revenue and the potential user-to-customer ratio. Losing potential customers who were ready to buy but turned away is a significant problem that can lead to both sales losses and a tarnished reputation.

In the age of information overload, heat maps serve as beacons of clarity, transforming complex data into actionable insights. Whether you’re a cybersecurity expert, a data analyst, or a business owner, understanding and harnessing the power of heat maps can propel your endeavors toward greater efficiency and success.
Network Elites, a trusted provider of IT services, utilizes heat maps to enhance its IT solutions. Our services are designed to provide businesses with highly customizable IT solutions tailored to their specific needs and goals. Heat maps are essential for optimizing IT infrastructure, ensuring efficiency, and improving cybersecurity.

Protect against loss and crisis.